President’s Corner – Fall 2023

Julé Rizzardo, PH, AIH President, 2023-2024

The change of seasons is upon us, and with that, I’d like to announce some changes in our management team. We are grateful to Smith Moore and Associates for three years of management services as we transitioned our organization headquarters to Sacramento, published our first digital newsletter, and launched our webinar series. Now, we are poised to continue growing our organization and connecting with members with the help of a new management team. The new team is handling all aspects of administering AIH, including membership, certification, exams, marketing and financial services.

Please meet the team!
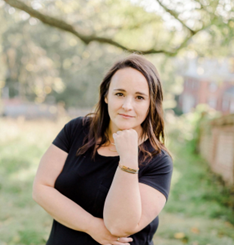
Ginger Tinsley, Membership and Certification Database Manager 

Ginger brings extensive association management and business development experience to AIH. She has managed associations for medical professionals for over a decade, including member engagement, board facilitation, database management, strategic planning, and legislative initiatives.

Megan Balkovic, MHB Services, Owner 

Megan is the owner of MHB Services, a consulting company for small nonprofits, and provides digital marketing and communication expertise for AIH. She manages our social media platforms, and develops digital content to market our newsletter, webinars and member communications.

Angie Agrey, Lethert, Skwira, Schultz and Co. LLP, Partner 

Angie provides financial and accounting services for AIH, including monthly financial reports, accounts receivable and payable, and will be assisting us with separating and tracking funds for the upcoming DEI Scholarship Program.

Upcoming Exam Schedule

February 2, 2024: 9:00 AM to 1:00 PM PST, Fundamentals Exam (Hydrologist in Training )
March 15, 2024: 9:00 AM to 1:00 PM PST, Professional Hydrologist Exam

Annual Membership Renewal

We are grateful to have you as a part of the AIH community and recognize that your commitment to us has been instrumental in shaping who the organization is today. We are ready to assist you in renewing your membership for the year ahead! 

Our goal is to provide you with excellence in member services, impactful educational offerings, timely and applicable communications, and opportunities to connect and network with others in hydrology. That’s why now is the best time to renew your membership and keep your certification active. Renew now before it expires on January 15, 2024 – it only takes a few minutes!

AIH offers you numerous reasons to continue to keep your membership current:

  • Maintain your certification as a professional hydrologist or hydrologic technician
  • Build your career as a hydrologist-in-training or student member
  • Earn continuing education credits with free access to AIH webinars
  • Nominate yourself or colleagues for AIH annual awards
  • Receive recognition by your peers and employer for achieving professional competence in hydrology
  • Contribute to the work of AIH Committees and submit articles for the AIH Bulletin
  • Belong to a community of colleagues with common professional interests and opportunities to collaborate
  • Take leadership roles in the Board of Directors and Board of Registration

Our dedication and commitment to you and the hydrology industry is unprecedented – you won’t want to miss what’s next! 

We’re improving our database operations in an effort to make renewing your membership easier and more accessible. To get started online:

  1. Log into Certemy online at https://app.certemy.com/entry/login. You’ll need your email address and password associated with your Certemy account.
  2. Can’t remember your password, click “Forgot Password?”, enter the correct email, and a link to reset your password will be emailed to you.
  3. Can’t remember which email you use for Certemy (hint: it’s the same email that this Bulletin was sent to) or need more assistance? Contact Ginger Tinsley at admin@aihydrology.org or call (540) 500-1933.

If you are still unable to renew your membership, then you can renew on our website and select your membership type:

  • Professional Hydrologist Membership ($150/annually)
  • Hydrologic Technician Membership ($90/annually)
  • Hydrologist-In-Training ($100/annually)
  • Student Membership ($20/annually)
  • Emeritus ($50/annually)

Call for Committee Volunteers!

AIH needs you to support a variety of AIH’s volunteer committees. Read below for more information on how to get involved.

Diversity, Equity and Inclusion (DEI) Committee
If you are interested in joining the DEI Committee and helping launch our very first DEI scholarship program in 2024, please contact co-chair John Ramirez-Avila (jramirez@cee.msstate.edu) or Matt Naftaly (mnaftaly@dudek.com). The Committee is finalizing scholarship application criteria and planning to make the first scholarships available for application in late 2024.

Communications Committee
This committee helps the Director of Communications with reviewing the technical articles for the AIH Bulletin. If you’re interested in joining, please contact the Director, Communications, Brennon Schaefer (brennon.schaefer@state.mn.us).

Member News

Dr. Richard Koehler, PH, Ph.D., CEO (Visual Data Analytics, LLC)
The American Institute of Hydrology is pleased to share news of the publication of Dr. Richard Koehler’s article titled “Quantifying Streamflow Properties using a Calculus-Based Differential Approach” in the journal Ecohydrology (October 2023). Dr. Koehler’s paper introduces an innovative approach to quantify streamflow temporal configuration using the lag(1) temporal autocorrelation signature of stream flow. His novel approach allows us to visualize, identify and quantify hydrologic alteration, which is a significant improvement over prevailing methods that relies on statistical-based index parameters.

We also thank Dr. Koehler’s past contributions to AIH. On June 16, 2022, he presented a webinar for AIH, titled “A Novel Approach to Quantify Streamflow Properties” where he included an overview on the autocorrelation method. He also published two articles for the AIH Bulletin: “A Climate Condition Analysis Using Palmer Hydrologic Drought Index (PHDI) Values”, June 2023 and “The Lag-1 Hydrograph – An Alternate Way to Plot Streamflow Time-Series Data”, September 2022.

Professor John Nieber, PH, PE, Ph.D., Professor (University of Minnesota)

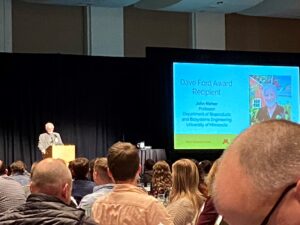
The American Institute of Hydrology would like to congratulate Professor Nieber on receiving the prestigious Dave Ford Award in 2023 by the Water Resources Conference planning committee. The award is for professional and other related disciplines working in water resources. It honors a person for significant long-term achievement or public service in water resources management who exhibits the collaborative leadership style of Dave Ford.

Dr. Nieber has a record of outstanding achievements in the management of water resources. This record includes significant contributions in teaching, research, and public service. As a professor in the Department of Bioproducts and Biosystems Engineering at the University of Minnesota, Dr. Nieber has served as teacher and mentor for hundreds of students. His pedagogical approach blends theoretical rigor with the realities of complex watersheds. Dr. Nieber has provided invaluable leadership in the Water Resources Science graduate program serving as the Director of Graduate Studies. The breadth of his research is amazing, with projects ranging from the determination of water storage volume across Minnesota landscapes to the rigorous analysis of “fingering” caused by instabilities in unsaturated flows. Dr. Nieber has been a leader in establishing professional registration for hydrologists. He has served on the Executive Committee and as President of the American Institute of Hydrology. His collaborative leadership has resulted in strong working relationships with professionals working in academe, governmental agencies, nonprofit organizations, and consulting firms. He has inspired us to reach higher and work smarter.

Conference Update

AIH Awards at the AWRA 2023 Annual Water Resources Conference

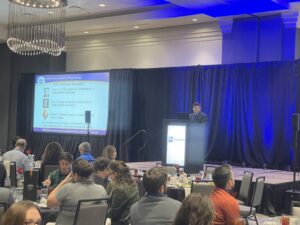
Dr. Zhong Zhang represented the American Institute of Hydrology (AIH) this year at the Annual AWRA Conference in Raleigh, November 6-8, 2023. The conference included plenary and concurrent sessions featuring dynamic keynote speakers, panel discussions, technical sessions and short workshops. 

During the award ceremony, which took place on November 8th, Dr. Zhang presented three AIH awards for outstanding hydrologists in the areas of groundwater, surface water and Founders Award for Institute Development. The Charles V. Theis award for groundwater was presented to Dr. Ken Howard. The Ray K. Linsley award for surface water was presented to Dr. Jeff McDonnel. The Founders Award for Institute Development was presented to Dr. John Nieber, who was the past AIH President (2019 to 2020). During the award ceremony, Dr. Zhang provided an overview about AIH and presented notes on behalf of the awardees, who could not be present at the conference.


Dr. Zhang also gave a workshop about the Hydrologist-In-Training (HIT) examination to interested attendees. In addition, Dr. Zhang gave a presentation titled “Evaluating Carbon and Nitrogen Discharged from the South Fork of the Iowa River and the Relation of these Discharges to Agricultural Conservation Practices”.

Webinar News

In our last webinar, Dr. Dan Wright described exciting new techniques for climate-informed design rainfall and floods in large river basins. The feedback from that webinar was extremely positive, and we loved the members’ engagement. A few members requested that we go further into the application of such methods; and we listened. On our next webinar, to be held on January 11, 2024 at 9:00 AM PST, we are thrilled to have Greg Karlovits, Acting Chief of the Hydrology and Statistics Division at the USACE Hydrologic Engineering Center (HEC), presenting some new features within the Hydrologic Engineering Center’s Hydrologic Modeling System (HEC-HMS). HEC-HMS was developed by the U.S. Army Corps of Engineers and is largely used by the hydrology community to simulate and model the rainfall-runoff processes in a watershed. One of the new features that will be discussed during the webinar is the capability of implementing storm shifting within HEC-HMS.

We’re committed to providing valuable insights and resources to help you succeed and stay informed. We plan our webinars with our members in mind. In the coming year, we are considering a large list of hot topics in hydrology, including climate change, water quality, sustainability, dam safety, forecast-informed reservoir operations, and much more. If you have any recommendations, or requests, for a future webinar, we would love to hear from you. Please contact Luciana Kindl da Cunha at lcunha@westconsultants.com.

Technical Article: An Improvement to Node Positioning Algorithms

An Improvement to the Node Positioning Algorithms of the Method of Fundamental Solutions and Complex Variable Boundary Element Method

Authors: 

Sebastian A. Neumann1, Saleem A. Ali2, Theodore V. Hromadka II3

1Cadet, United States Military Academy, United States of America
2Cadet, United States Military Academy, United States of America
3Distinguished Professor, United States Military Academy, United States of America

1 Abstract

In this work we examine use of various geometries and schemes for defining computational node positions on the complex plane. Circular patterns may be of interest for problems involving groundwater well fields or studies of well placement spacing and the like. This contrasts with existing methods, which used candidate nodes and refined them based on performance. One of the most pertinent use-cases we discussed when working on this method was the case of pinpointing the source water contamination in a suburban/urban setting. With existing methods, it is challenging to accurately model the flow of drinking water as it moves from supplier to consumer. This can become an issue if it gets contaminated at some point along the pipe. With some refinement, we believe this new method can be used to efficiently model fluid flow through potable water pipes, allowing investigators to generate a more accurate picture of possible contamination sources, allowing for better resolution of the crisis. 

2 Literature Review

The Complex Variable Boundary Element Method (CVBEM) was used for modeling groundwater transmission by Wilkins et al.,[1]. The Wilkins method generates an initial distribution of node candidates, and gradually introduces these candidates into the final model, optimizing for the lowest error on the boundary. Also of note is the work of DeMoes et al.,[2], who detail in their paper the method iterated upon by Wilkins et al.

3 Methods

The CVBEM method for solving 2-dimensional boundary value problems positions a set of candidate nodes in a grad pattern outside the Study Domain. As more collocation points are added to the approximation function, nodes are chosen from this set and refined to give the best possible approximation for each given node (best being minimum difference between the known boundary function and the approximation function). In this work, we replace the existing method for positioning nodes with a less accurate, but more computationally efficient method.

In this method, rather than selecting candidate nodes and refining them, we simply generate the nodes based on a pre-determined probability density function. For our examples, we used a circle as the basic shape, then added variance to each point’s distance from the boundary (according to the normal distribution). This led to a band of points with some closer to the Study Domain and some farther away.

Now, rather than going through the much-laborious process of refining each candidate node each iteration of the algorithm (computationally, O(n2) time), we simply generate a pseudo-random point in accordance with the predefined probability distribution, which still proves to be quite effective and has a computational time of O(n).

4 Results

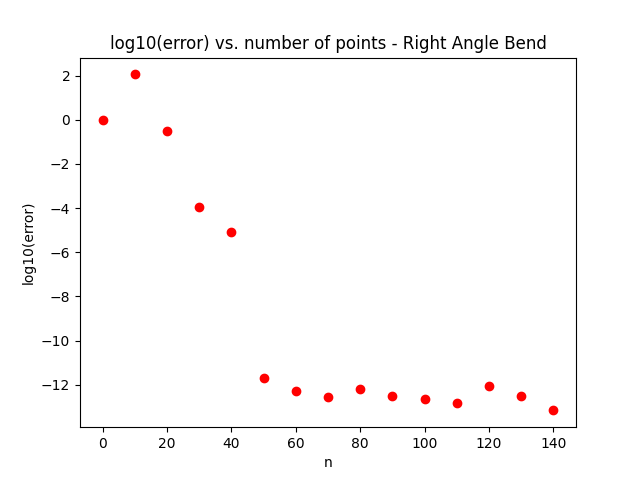
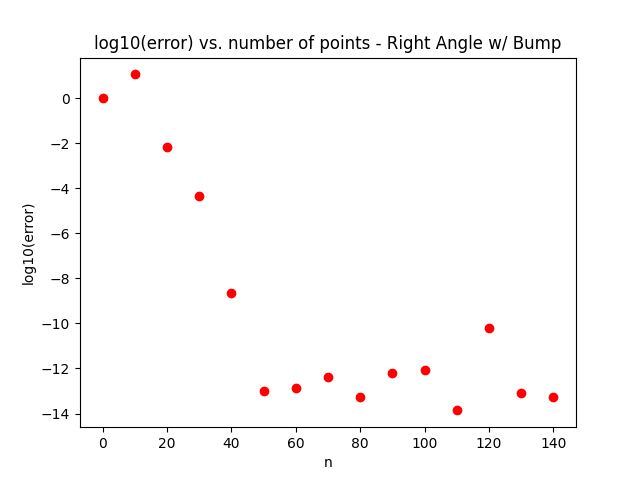
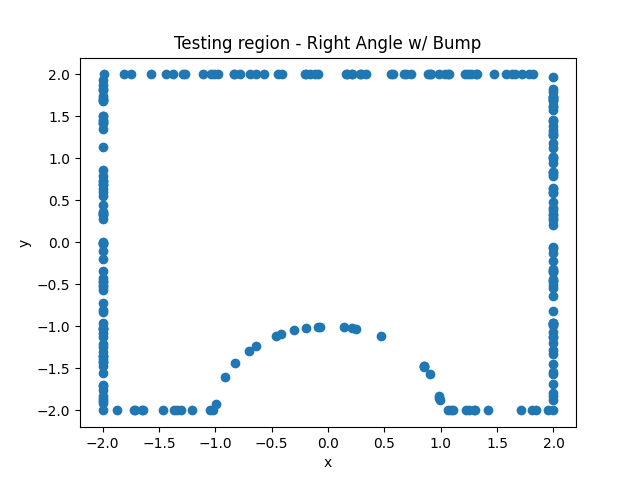
Overall, this method decreases accuracy by a factor of 102 while speeding up computation by a factor of 104. The charts below show a comparison between the two methods on some of the benchmark problems shown in the original CVBEM paper. Figure 1 shows a plot of the log of the error as the number of points is increased for our first benchmark – the 90-degree bend. Figure 2 shows the same plot but for our second benchmark – the 90-degree bend with a hump.

Figure 1
Figure 2
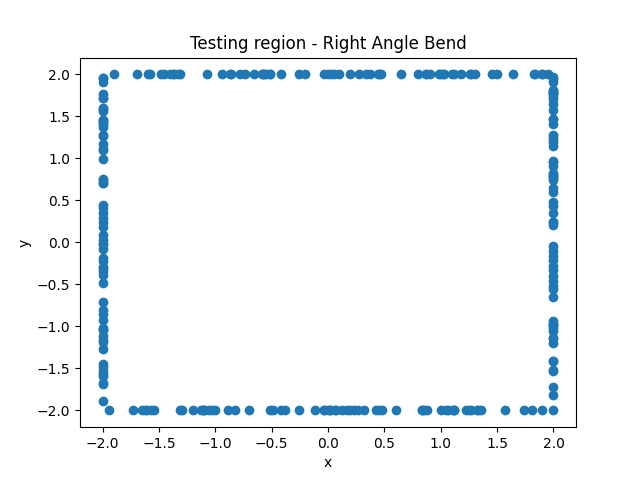
Also included are a few graphics of the benchmark problems to show how the points are arranged with respect to the boundary. Figure 3 depicts the 90-degree bend problem and Figure 4 depicts the 90-degree bend with hump.
Figure 3
Figure 4

We noticed that the irregularity of the surface negatively contributes to the accuracy of the model. In Figures 3 and 4, we demonstrate the use of 150 node and collocation point pairs to generate our results and, in these specific problems, these were sufficient in lowering the maximum error to under 10−14. However, in the problem only concerning the 90-degree bend, this method was able to progress to a further 10−16, a significant improvement.

5 Conclusions

With the initial methods, we attempted to define a pure algorithm which has a basis in logic and mathematical principles. While this algorithm was effective, and could be shown to converge, it was impractical to implement for real-world simulations. The real world is messy, and the margin for error of measurements taken is far higher than any of our models introduce. For that reason, even though this new method loses some fidelity, this error is vastly outweighed by the errors created by measurement devices. By creating a faster, less computationally demanding algorithm, we can make it easier to implement in real-world applications.

6 Post-Script

Sebastian Neumann is a cadet at the United States Military Academy studying mathematics and computer science. In his free time, he enjoys tutoring his friends in various computer science classes and is working on an introductory video for all prospective CS majors at West Point.

References

[1] B. D. Wilkins, T. V. H. II, W. Nevils, B. Siegel, and P. Yonzon, “Using a node positioning algorithm to improve models of groundwater flow based on meshless methods,” 2014.

[2] N. J. DeMoes, “Optimization algorithm to locate nodal points for the method of fundamental solutions,” 2014.

Technical Article: The Enhanced Flow Duration Curve

The Enhanced Flow Duration Curve

Author: 

Richard Koehler, PhD, PH
CEO, Visual Data Analytics, LLC
visual.data.analytics@outlook.com

Abstract

Flow duration curves (FDCs) are a mainstay analysis technique examining the composition of streamflow using a ranking system approach. But, despite the multiple versions developed over the past 100+ years, FDCs have never been able to display day-to-day discharge information – until now. Presented is a technique to add temporal sequence information to the fundamental FDC by incorporating a lag(1) autocorrelation scatterplot. This modification shows regions of daily discharge increases (dQ/dt > 0), discharge persistence (dQ/dt = 0), discharge decreases (dQ/dt < 0), and the number and degree of daily discharge changes. The result is a more informative visual representation of streamflow.

Key words: enhanced flow duration curves, lag(1) autocorrelation, daily discharge variation, discharge permutations

Background

Flow duration curves (FDCs) have a long history as a hydrological analysis tool with a straightforward graphical display and ease of construction. In general use since 1915, the FDC is essentially a cumulative frequency curve showing the percentage of the period of record where specific discharge levels were equaled or exceeded (Searcy, 1959). FDCs are computed by ranking daily-value data and assigning exceedance probabilities or percentages to each value by means of a plotting position formula, such as the Weibel equation used in this study (Ziegeweid et al., 2015).

Limitations

A serious FDC issue deals with probability plots. Such plots assume that the data used are independent, identically distributed (IID) random data points. However, stream discharge is often highly autocorrelated (flows followed by similar flows), which violates this assumption.

Given that FDCs do not show the chronological sequence of flow (Searcy, 1959), it means all FDCs represent just the dataset composition. Unless the time-based order of the source data is somehow included, it is not possible to know if the IID assumption is valid. Therefore, until this assumption is validated, the flow duration calculations must be treated as percentages and not probabilities. A descriptive example follows.

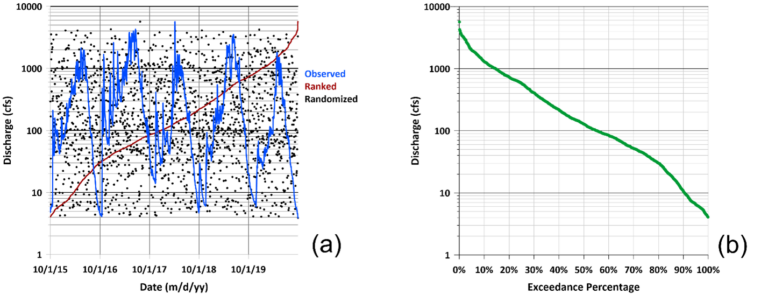
Figure 1 shows the observed hydrograph from WY 2015 to 2020 for the Merced River at Happy Isles Bridge near Yosemite, California (USGS site 11264500) along with two reordered hydrographs – one ranked (extreme persistence, extremely stable with autocorrelation (r) ≈ 1) and one randomized (no persistence, extremely flashy with autocorrelation (r) ≈ 0). All three plots have identical FDCs as the data composition is identical. Only the data timing is different.

Figure 1. WY 2016 to 2020 observed, ranked, and randomized hydrographs, Merced River (a), with common FDC for all three hydrographs (b).

A single FDC, in fact, represents all permutations of the source dataset since the composition is the same regardless of the data time-based order. The permutation value is the number of ways to choose a sample of elements (r) from a set of distinct objects (n) when order matters and replacements are not allowed.

P(n,r) = n!/(n-r)! Eq (1)
where n = total number of objects, r = number of objects selected, and 0! = 1

Given a daily FDC with a one-year period for the source data, the number of possible arrangements is estimated to be P(365, 365) = 2.5 · 10778. For comparison, astrophysicists estimate the number of protons in the known universe, the Eddington number, as 1.5 · 1080 (Abramowicz, 2008). The challenge is clear – how is it possible to make an FDC unique to a specific dataset and to know if the source data meets the IID condition?

Enhanced Flow Duration Curve

There is a surprisingly simple solution that also provides additional information about the source dataset and addresses the IID issue. The answer is to use a lag(1) autocorrelation scatterplot in conjunction with an FDC and calculate the lag(1) autocorrelation coefficient, r(1).

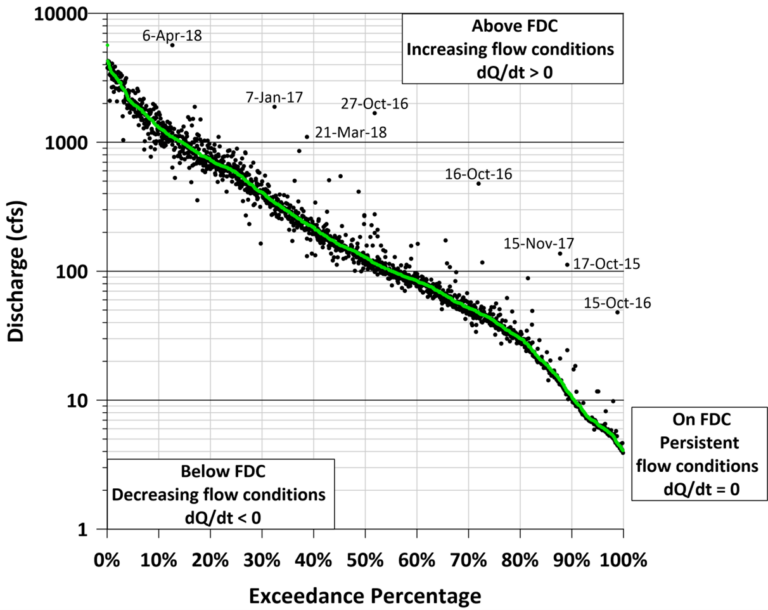
For this study, day-to-day pairings use a Qt, (flow for day “t”) and Qt+1 (flow for following day “t+1” ) system, where “1” represents one-day lag between the discharges. By using the Qt exceedance percentage for the x-axis and the Qt+1 discharge value for the y-axis, a unique overlay of next-day discharge points is possible for the FDC. Table 1 summarizes these values. Figure 2 shows the enhancement (compare to Figure 1b).

Table 1. Date, FDC exceedance probability values, and lag(1) autocorrelation data order.
Figure 2. Enhanced FDC, WY 2016 to 2020 for the Merced River, USGS site 11264500.

The spread of Qt+1 datapoints is key to visualizing the autocorrelation within the dataset. Points clustered along the FDC line indicate more persistent, stable conditions with higher autocorrelation, while increasingly scattered points indicate more random, flashier conditions with smaller autocorrelation.

This is consistent with Heckert and Filliben (2003) for describing a lag(1) autocorrelation scatterplot. They state that a tight clustering of data points along the (Qt = Qt+1) line is a signature of positive autocorrelation, indicating highly persistent conditions. Conversely, if the data points have a loose, dispersed pattern, it is a signature of lower autocorrelation and that the data are more random.

Conclusion

This short article is an introduction to the concept of an enhanced flow duration curve (EFDC) and some of its benefits. By combining two common hydrologic tools, the flow duration curve and the lag(1) autocorrelation scatterplot, a more informative graphic is now available.

Multiple applications include enhanced water resources management, improved detailed information about a river system, more targeted ecohydrology research projects, and new digital model evaluation methods, among other possibilities.

Remarks

The author thanks AIH for the opportunity to share this self-funded research.

Abramowicz, M. A., 1988, Eddington number and Eddington mass, The Observatory.
https://adsabs.harvard.edu/full/1988Obs…108…19A/0000019.000.html

Heckert, N., & Filliben, J., 2003. NIST/SEMATECH e-Handbook of Statistical Methods; Chapter 1: Exploratory Data Analysis.
https://doi.org/10.18434/M32189

Helsel, D.R., Hirsch, R. M., Ryberg, K. R., Archfield, S. A., & Gilroy, E. J. (2020).
Statistical Methods in Water Resources: U.S. Geological Survey Techniques and Methods, book 4.
https://doi.org/10.3133/tm4A3

Searcy, J.K., 1959. Flow-Duration Curves (Report No. 1542). US Government Printing Office.
https://pubs.usgs.gov/publication/wsp1542A